
Yamuna & water
Why is the Yamuna so polluted in Delhi?
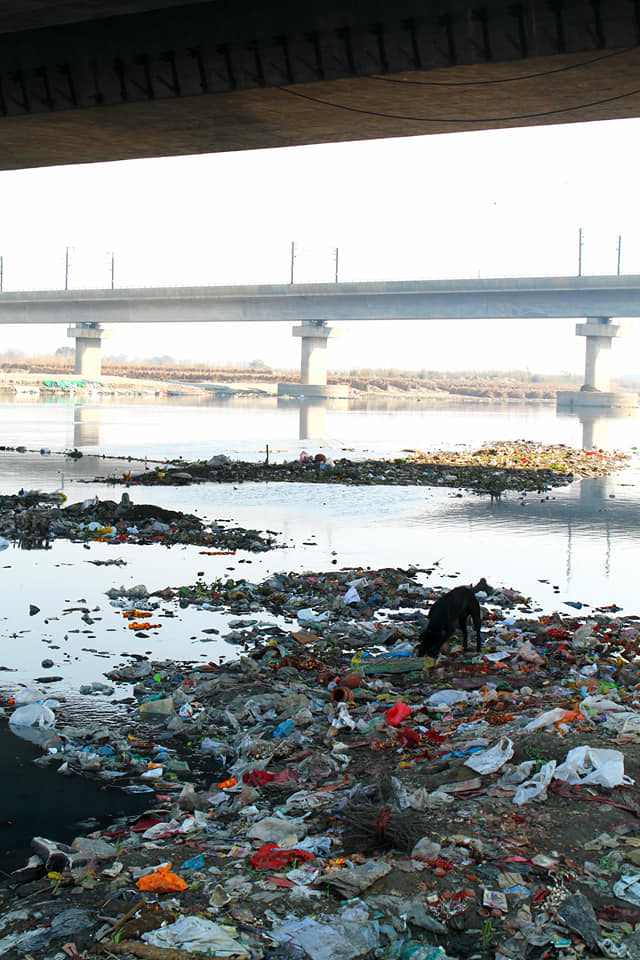
Because in Delhi the river is barely a river. Almost all its flow is taken out at Wazirabad for the city's drinking water, and what continues downstream is largely drain discharge. The stretch from Wazirabad to Okhla is about two per cent of the Yamuna's length and carries the great majority of its pollution load — CPCB's own 2025 monitoring shows dissolved oxygen at or below the reporting floor at four consecutive Delhi stations.
A river with its water taken out
Dilution is what a river uses to survive a city. Delhi's stretch does not have any.
The Yamuna enters Delhi at Palla with water in it. At Wazirabad barrage the great majority of that flow is abstracted for the city's water supply. Below the barrage the channel continues, but what is in it during the dry season is substantially the discharge of Delhi's drains — the Najafgarh drain and the Shahdara drain being the two largest.
That is the mechanism. The organic load a city of this size produces would be heavy anywhere; what makes the Delhi stretch exceptional is that there is almost no clean water left to dilute it. Sewage that would be diluted a hundredfold in a flowing river is here diluted very little.
CPCB's own 2025 river data shows the pattern station by station. At Palla, upstream of the barrage, dissolved oxygen runs between 5.4 and 9.8 mg/L. Four stations later, from ISBT Bridge down to Okhla after the Shahdara drain joins, the minimum reads 0.3 mg/L — which is the floor the method reports, so the real value is at or below it.
- Abstraction
- Water taken out of the river for supply. At Wazirabad this is most of the dry-season flow.
- Environmental flow
- The minimum flow a river needs to stay functional. India has no enforceable e-flow notification for the Yamuna's Delhi stretch.
- Reporting floor
- The lowest value a method will report. CPCB's dissolved-oxygen figures bottom out at 0.3 mg/L, so "0.3" means "at or below 0.3", never zero.
What the river is judged against
These are the Primary Water Quality Criteria for outdoor bathing, notified under the Environment (Protection) Rules, 1986. They are printed in the header of CPCB's own monitoring table.
Dissolved oxygen
> 5.0 mg/L
PWQC, Environment (Protection) Rules 1986
Biochemical oxygen demand
< 3.0 mg/L
PWQC, Environment (Protection) Rules 1986
Faecal coliform
< 2500 MPN/100 mL
PWQC, Environment (Protection) Rules 1986
pH
6.5 – 8.5
PWQC, Environment (Protection) Rules 1986
Stations monitored on the river
33 stations
CPCB National Water Quality Monitoring Programme, 2025
Faecal coliform at the Delhi stations is reported in millions per 100 mL against a criterion of 2,500. That is not a marginal exceedance and it is not a modelling artefact — it is CPCB's own published measurement.
How to read the river's numbers
Two figures decide it, and they move in opposite directions.
Dissolved oxygen is what the river has. Biochemical oxygen demand is what is being taken out of it. A healthy stretch has high DO and low BOD; a dead one has the reverse, and Delhi's has the reverse.
CPCB publishes a minimum and a maximum per station per year, not a mean. Both matter. The maximum tells you what the river can be after monsoon rain; the minimum tells you what it is in the dry months when the abstraction bites. Quoting only the maximum is the commonest way this dataset is made to look better than it is.
The Delhi stretch is short. Confusing "the Yamuna" with "the Yamuna in Delhi" makes both a river in Uttarakhand and a drain in Okhla into one number, and they have nothing in common. At Yamunotri the DO is 11.2 mg/L.
What it does not measure
- It cannot be read as a trend. This is one year's monitoring; a comparison needs the same stations and the same method across years.
- It cannot tell you the volume of the problem. Concentration is not load — a small filthy flow and a large moderately polluted one can read the same.
- It does not measure heavy metals, pesticides or pharmaceuticals, none of which are in the five parameters above.
- A station is a point on a bank. It does not describe the whole cross-section of the river.
Where this comes from
Every figure above comes from one of these.
- Water quality data of river Yamuna, 2025 Central Pollution Control Board, National Water Quality Monitoring Programme · The per-station minima and maxima quoted above
- NWMP river water quality data Central Pollution Control Board · The landing page for the annual series
Reuse freely — CC BY 4.0. Each source above keeps its own terms.
Next
compared with other rivers? A national ranking of 47 rivers — and the coverage hole that stops it seeing the worst stretch of this one. Stand in it Yamuna Yatra The river from its source to the stretch this page describes, walked rather than read about.