
Impact
Every figure.
Programme by programme.
Children, schools, rivers, trees and volunteers.
Two numbers,
one programme
3M+
Children and young people reached Modelled
Bridge the Gap · cumulative, since 2000
50,000+
Students through the curriculum
Bridge the Gap · over fifteen years
The larger figure counts children in a school the programme entered. The smaller counts children who sat the sessions. Reach is what an organisation can claim; effect is what it can be held to. Both belong on the page, labelled, because publishing only the first is advertising and publishing only the second hides the scale of the work.
The smaller figure is a count of real schools and real students. The larger is arithmetic — schools a year, times years, times the children in a school — and the middle term of that is an estimate.
The register
Each one with the span it counts.
Children and young people reachedBridge the Gap · cumulative, since 2000
3M+
Modelled
Schools in DelhiBridge the Gap · every year
100–150
Students through the curriculumBridge the Gap · over fifteen years
50,000+
Schools in Delhi NCRBridge the Gap · over fifteen years
250+
The other 25 projects figures
Schools on year-long curriculaBridge the Gap · in 2019–20
200+
Butterfly parks across Delhi NCREco Action · cumulative
70+
Herb gardens across Delhi NCREco Action · cumulative
20+
Green cover in one Vasant Kunj parkEco Action · over a decade
5% → 90%
School groups a yearFarm School · annual, current
30
Dead leaves composted into soil on siteFarm School · cumulative
5,000 kg
Honey from the apiaryFarm School · cumulative
500 kg
Students taught directly, in classHealthy Cities · 2025–26 project period
2,000+
Partner schools across Delhi-NCRHealthy Cities · 2025–26 project period
26
Saplings and seeds plantedHealthy Cities · 2025–26 project period
3,000+
Influence Fellows, eight statesHealthy Cities · 2025–26 project period
10
Students in the schools that ran itHealthy Cities · 2025–26 project period
26,000–52,000
Modelled
People in the fellows’ communitiesHealthy Cities · 2025–26 project period
50,000+
Modelled
FellowshipsInfluence · each year
10
Volunteers, annuallyInfluence · since 2010
10,000
CollegesInfluence · since 2010
50
PlacementsInfluence · since 2010
200
Partner organisationsInfluence · since 2010
75
Youth groups in the CYON networkInfluence · since 2010
300+
Girls and boys through the programmeME to WE · over thirteen years
3,000+
Alumni who came back as peer leadersME to WE · over thirteen years
200+
Young people through job-exposure campsME to WE · since 2019
400+
Adolescent girls through the year-long journeyShe Leads Change · since 2017
50+
Girls in the wider Learning Communities cohortShe Leads Change
300
Girls recognised by the ELC Bright Promise AwardShe Leads Change · in 2018
57
Trees planted in Delhi NCRMonsoon Wooding · each year
~5,000
Trees planted and survivedMonsoon Wooding · cumulative
50,000+
Walks runCityScapes · in two decades
1,000+
People on themCityScapes · in two decades
100,000+
Journeys organisedGram Anubhav · cumulative
60+
Grassroots partners in the villages themselvesGram Anubhav · cumulative
100+
The other 3 journeys figures
Journeys organisedNatureScapes · cumulative
60+
Yatras runYamuna Yatra · since 2004
30+
Young people through the YatraYamuna Yatra · since 2004
10,000+
Editions, one every JuneYamunotsav · 2006–2014
9
People through itYamunotsav · 2011 onwards
3,000+
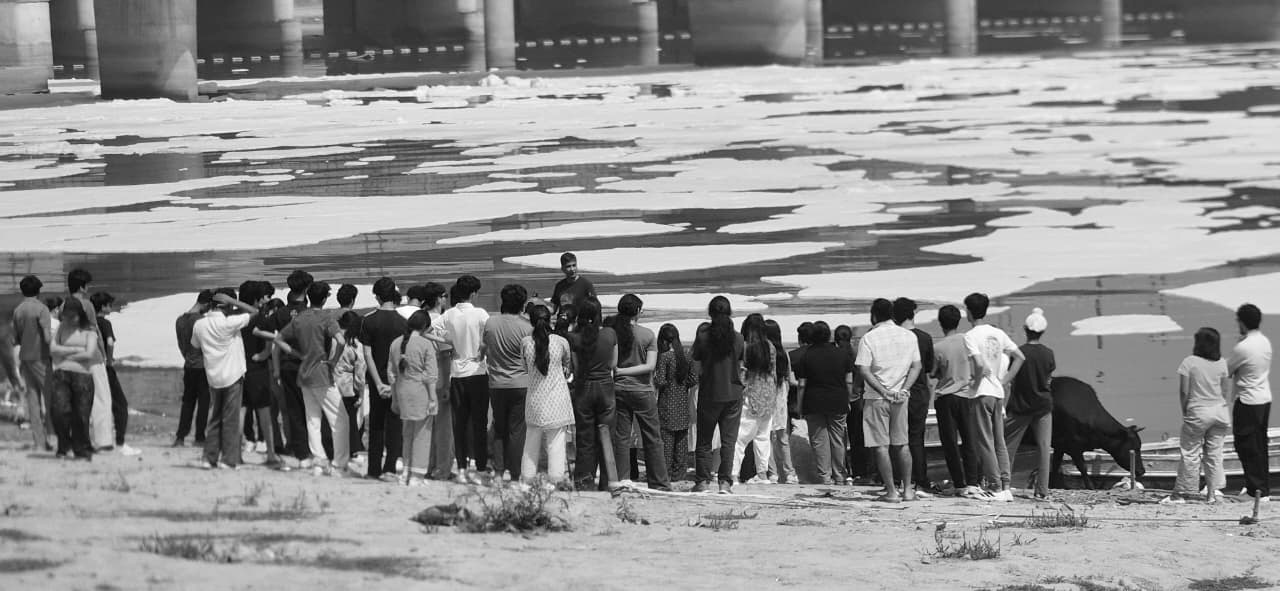
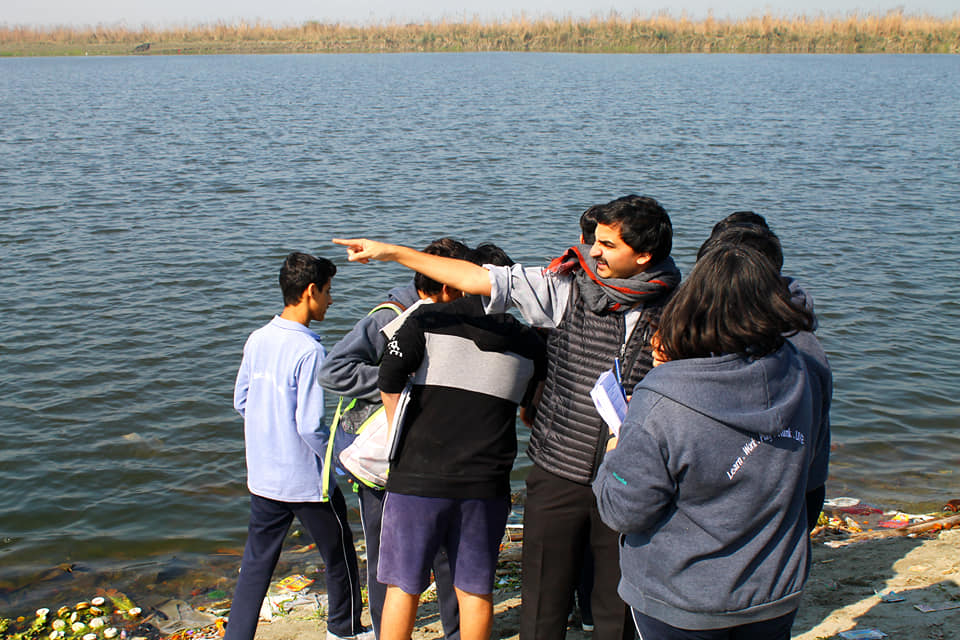
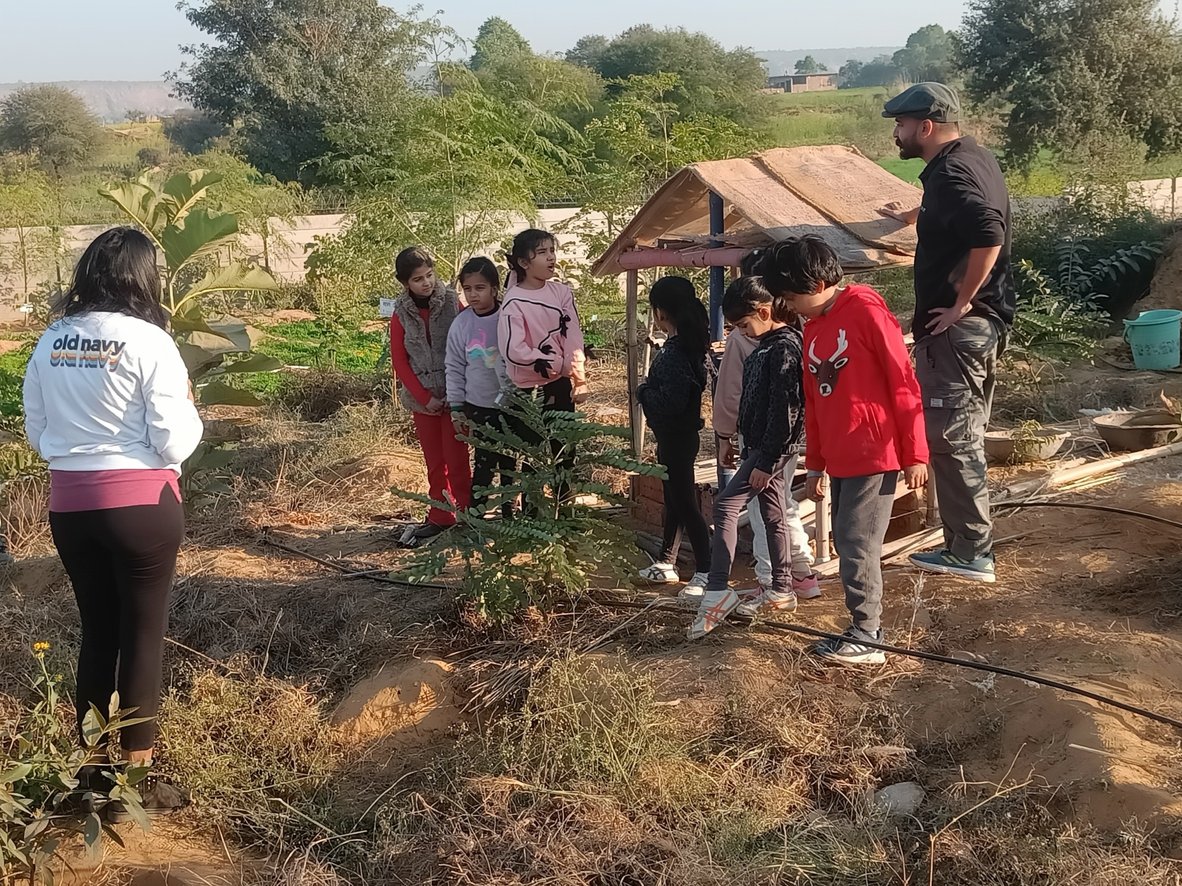
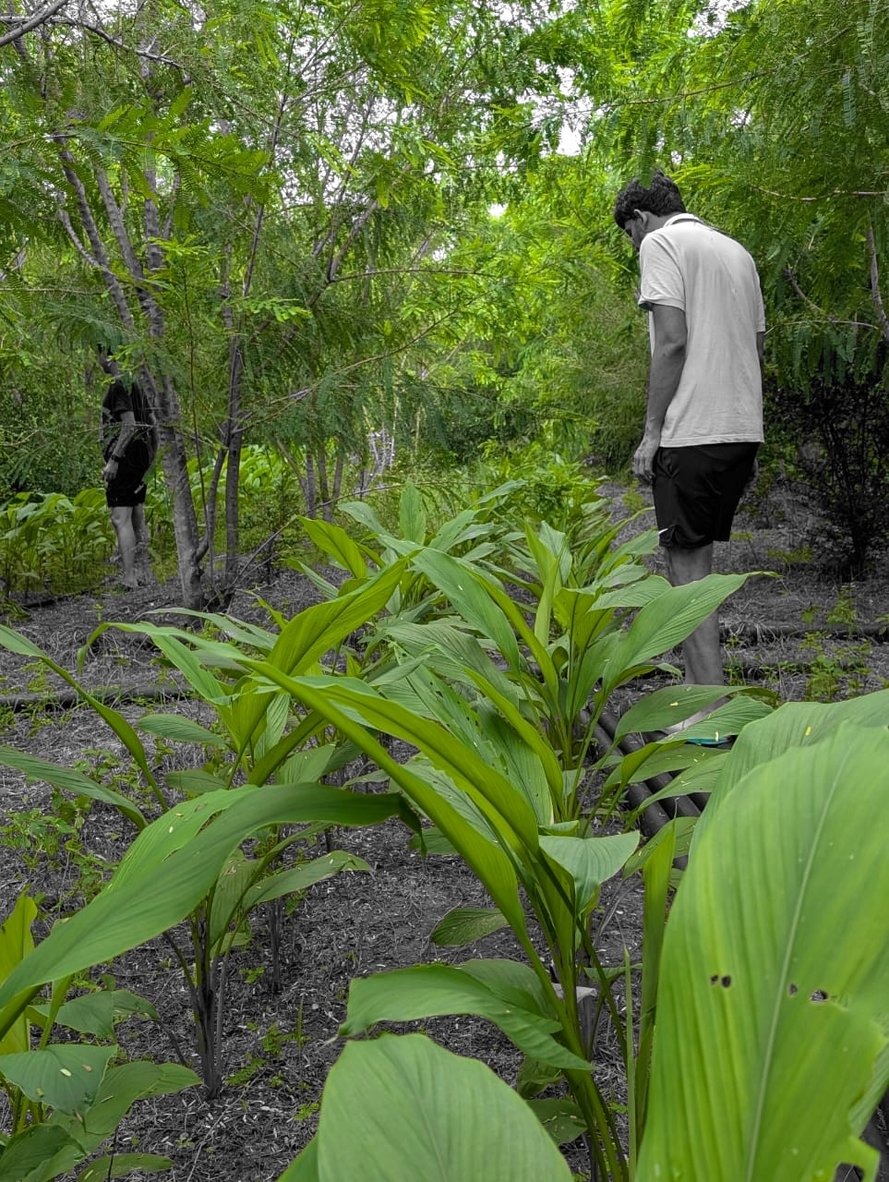
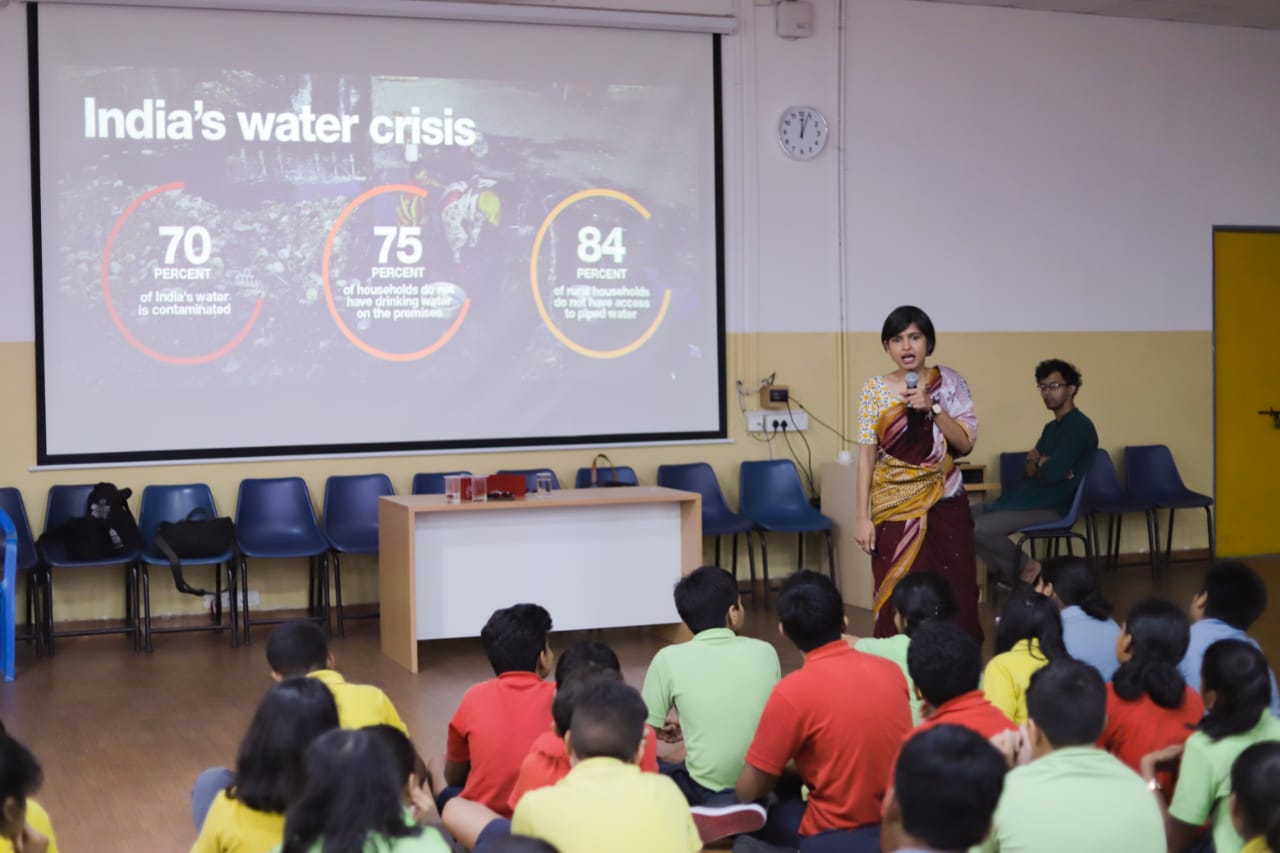
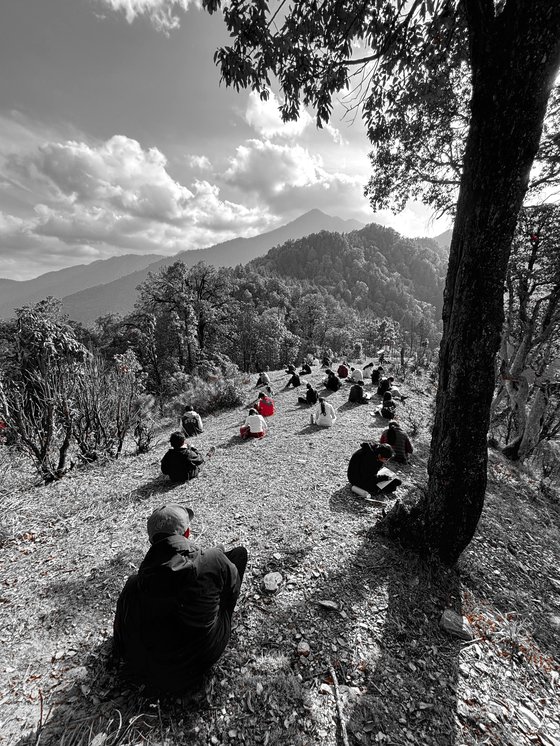
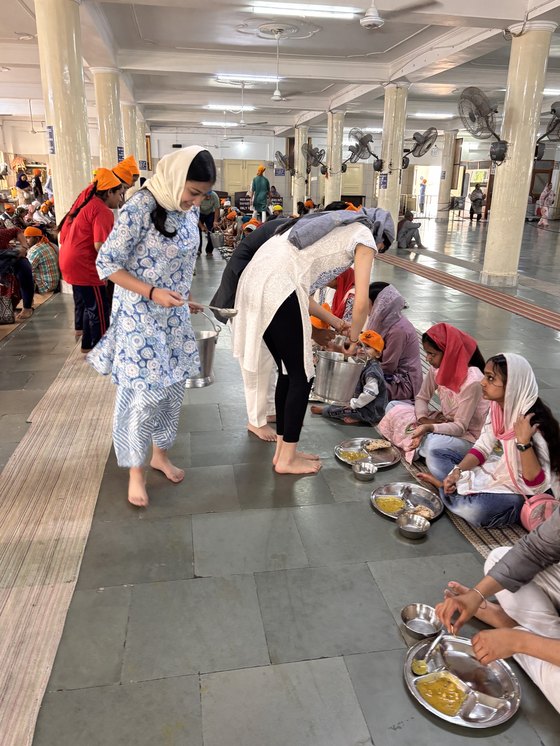
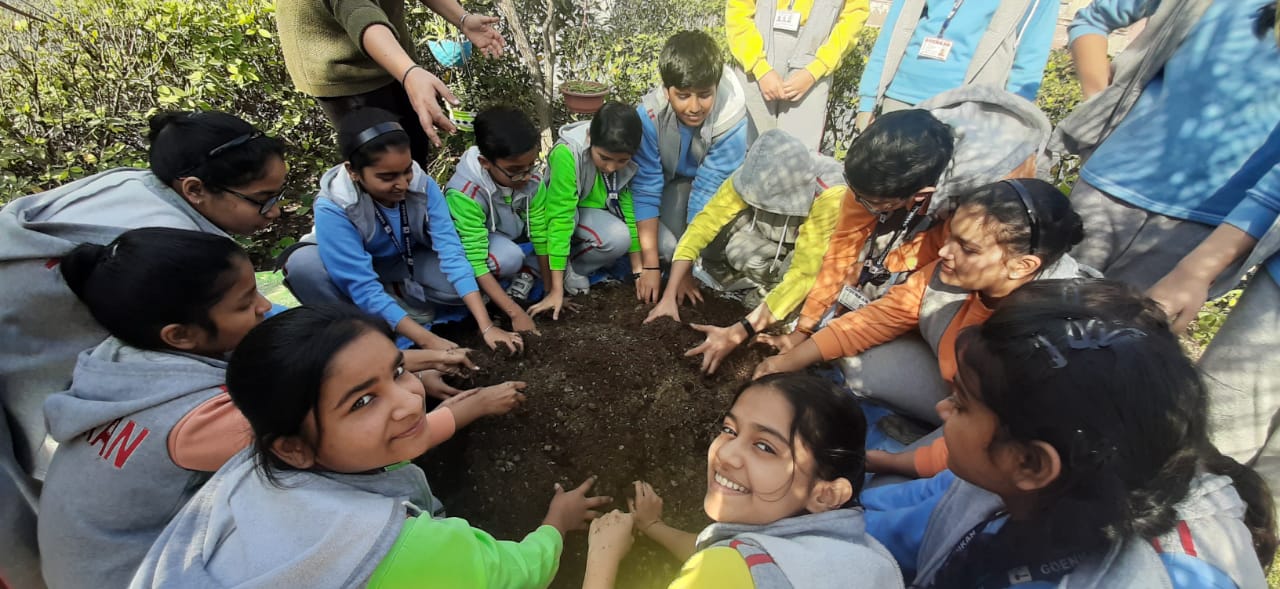
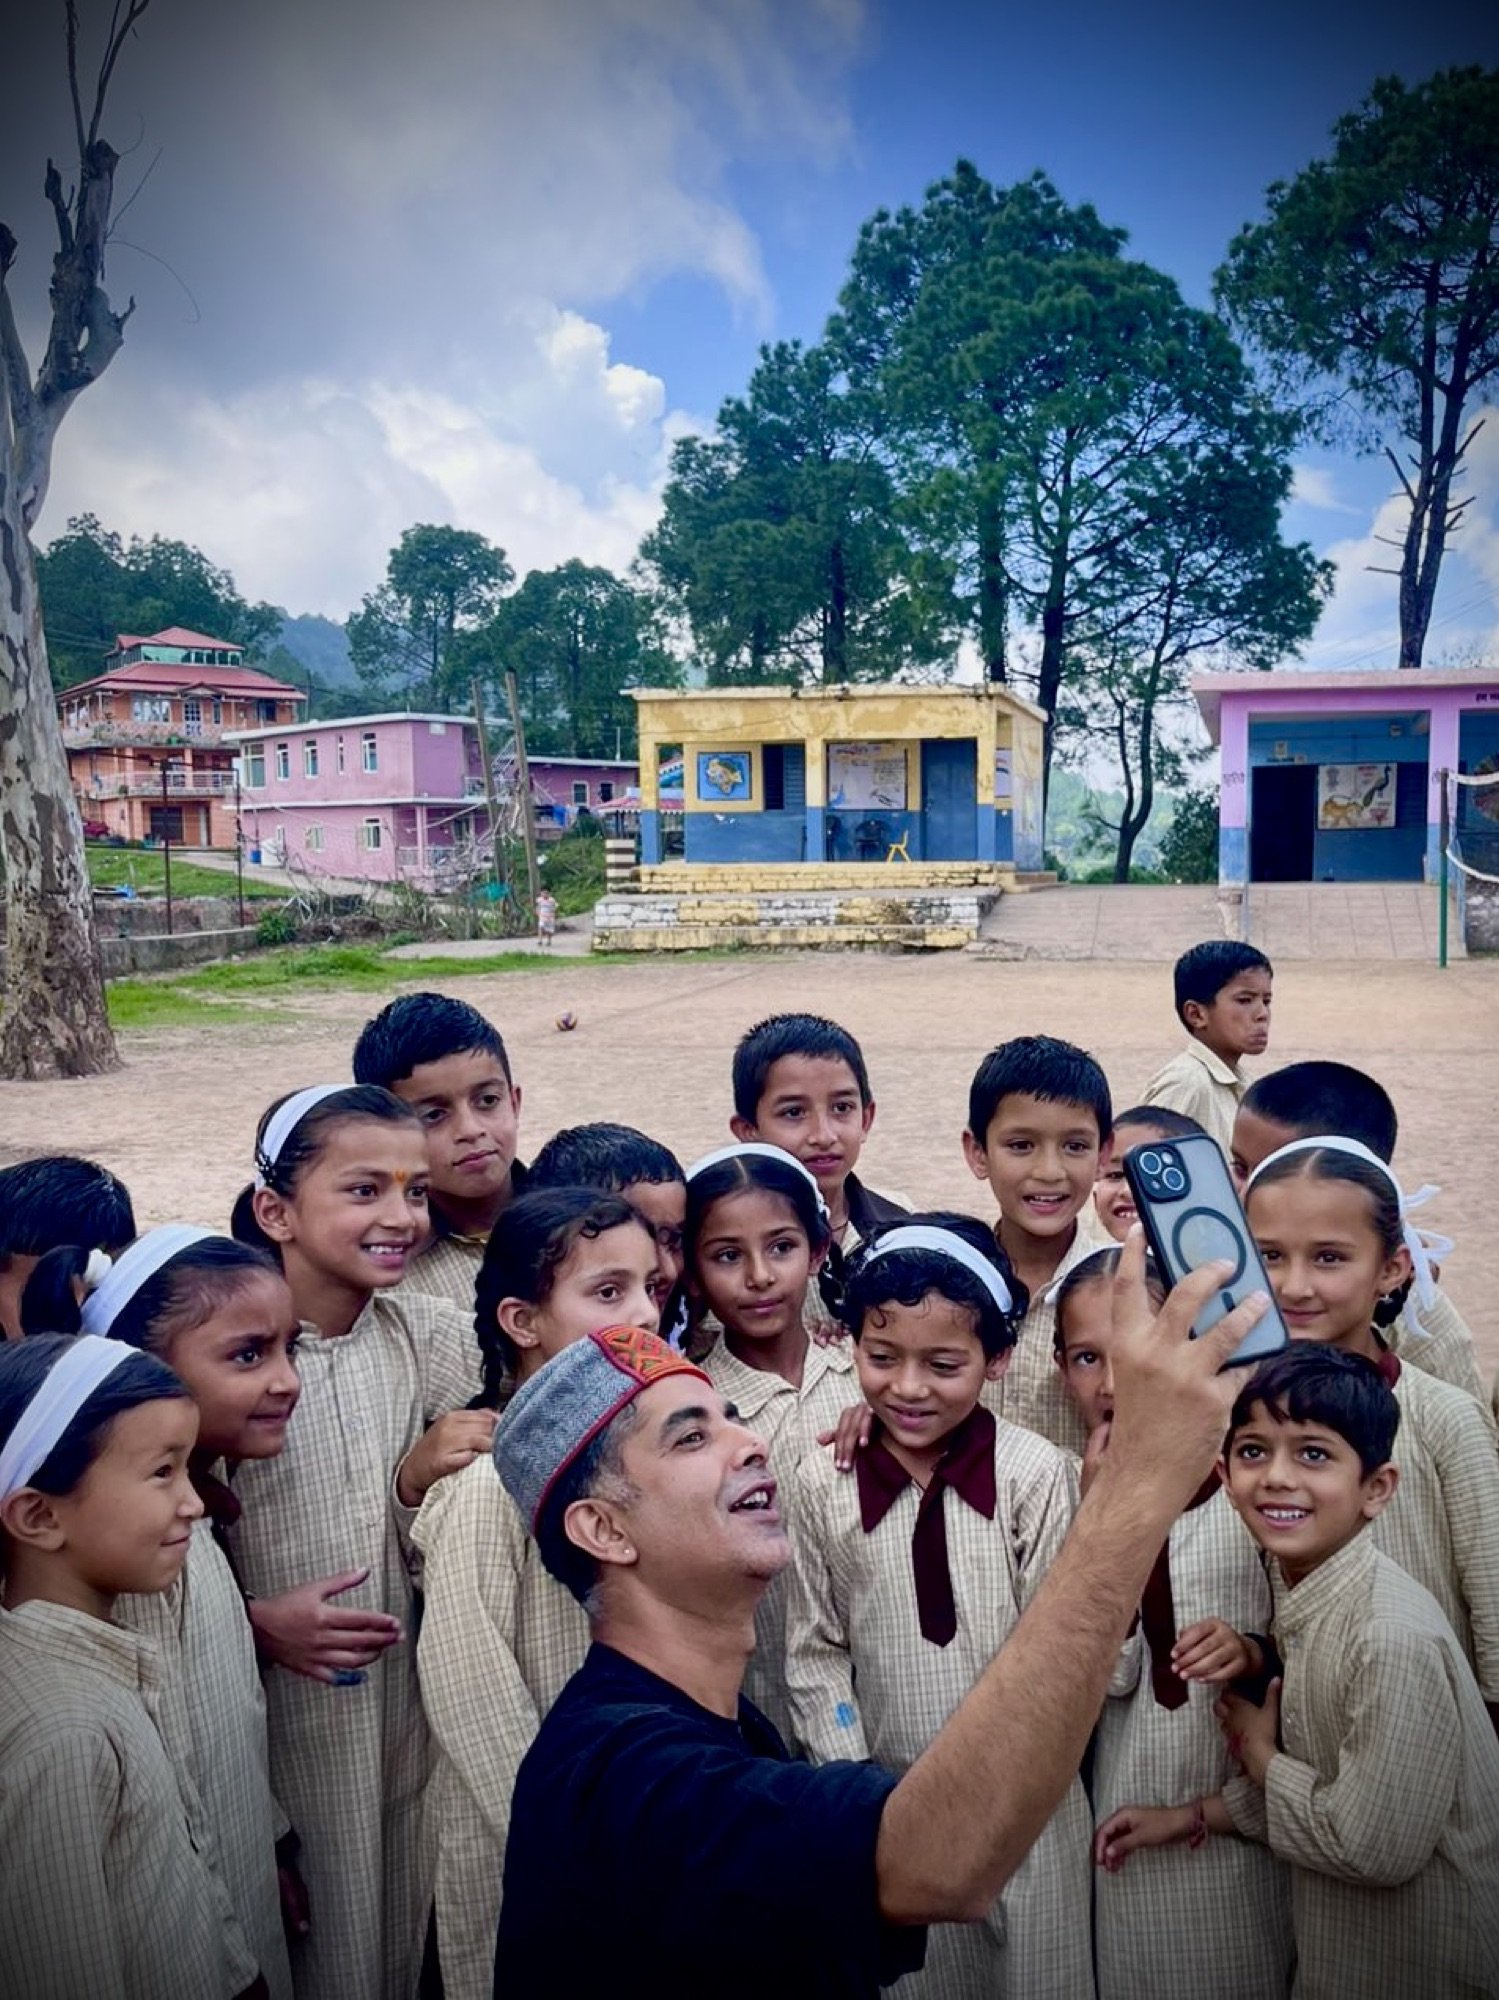
What it looked like
Frames from our own archive.
Where to next
The organisation behind these figures, the work they come from, and how to join in.
Once a month, what these numbers did.
One email. What the six readings did that month, what moved and what did not, and what we did about it. Nothing else, ever — no appeals between digests, and your address is never shared with anybody.
Confirm by email before anything is stored. Every message carries a one-click link to stop them.