
Yamuna & water
How polluted is the Yamuna,
compared with other rivers?
Ranked by the worst BOD reading at any of its monitored stations, the Yamuna comes eighth of the 47 Indian rivers with enough stations to rank — behind the Sabarmati, the Sirsa, the Hindon and others. That placing is misleading, and the reason is worth more than the ranking: the compiled table it is built from contains no Delhi station at all, so the Yamuna is ranked without the stretch everyone means.
How a river gets one number
A river is dozens of readings. Compressing it to one is a choice, and the choice decides the ranking.
Any national comparison has to reduce each river to a single figure. Taking the worst station is the defensible option: a mean rewards a long clean upstream reach and hides a dead one downstream, which for Indian rivers is the usual shape. Rivers with fewer than three stations are excluded, because one station is a station and not a river.
The parameter is biochemical oxygen demand, the standard proxy for organic pollution, judged against the bathing criterion of under 3 mg/L. Faecal coliform is carried alongside against its own criterion of under 2,500 MPN/100 mL.
The result is a ranking of 47 rivers built from 630 stations. It is genuinely useful for one thing — showing that the Yamuna is not uniquely bad, and that several rivers nobody has heard of are worse.
- Worst-station method
- A river's figure is its worst reading, not its average. Chosen because an average hides a dead reach.
- Times the limit
- The reading divided by the notified criterion. A ratio, so rivers with different absolute values stay comparable.
- Polluted river stretch
- CPCB's own classification, which assigns priority classes to lengths of river. A better instrument than a maximum-of-stations, and not what this table is.
47 rivers, worst station each
Against the criteria notified under the Environment (Protection) Rules, 1986.
Rivers with enough stations to rank
47 rivers
CPCB NWMP data, compiled
Stations behind the ranking
630 stations
CPCB NWMP data, compiled
BOD criterion
3 mg/L
PWQC, Environment (Protection) Rules 1986
Worst river in the table — the Sabarmati
82 mg/L BOD
27.3 times the criterion
The Yamuna, as this table sees it
26 mg/L BOD
8.7 times the criterion — eighth of 47
The Yamuna's worst BOD in CPCB's own Delhi data
72 mg/L BOD
CPCB 2025, Okhla after the Shahdara drain
Delhi Yamuna stations in the compiled table
0 stations
The hole this page is about
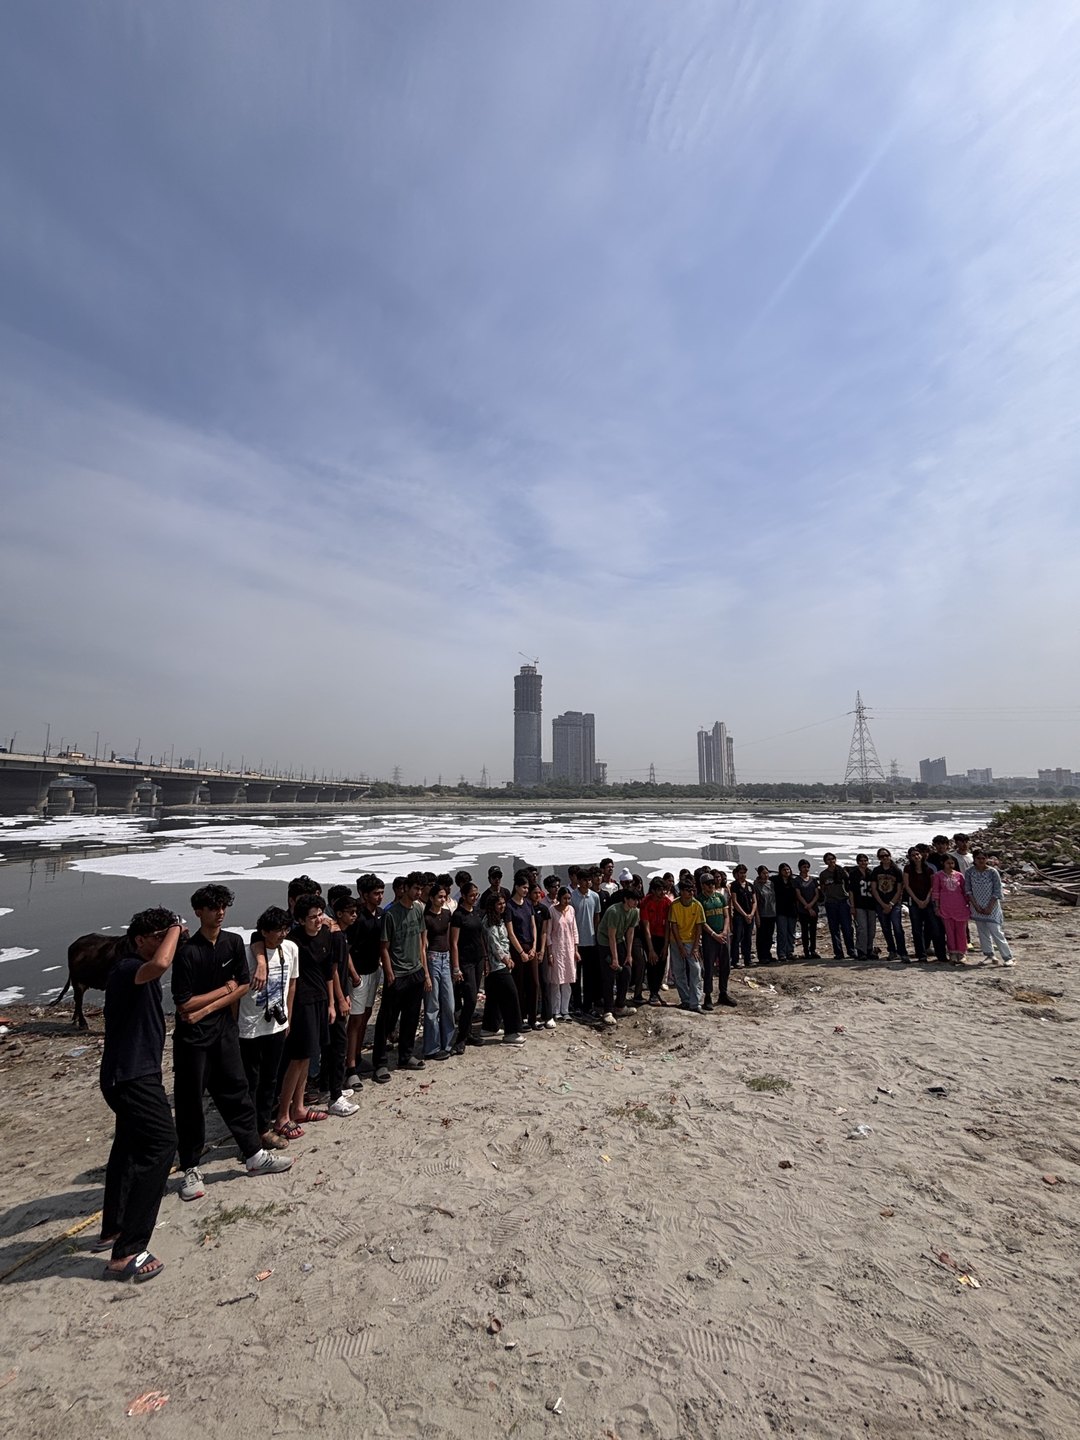
The same river, two figures. The ranking puts the Yamuna at 26 mg/L. CPCB's own direct data for the Delhi stretch reads 72 at Okhla after the Shahdara drain — nearly three times higher, and enough to move the river several places up a table it is currently eighth in. The gap is not a measurement disagreement. It is that the compiled table carries thirteen Yamuna stations and none of them is in Delhi.
That is why every reading on this site's own river page comes from CPCB directly rather than from a compiler. A secondary source is useful for a comparison no primary source publishes, and it inherits every gap in what it was assembled from.
How to read a river ranking
Four questions, and the coverage one is the one that is almost never asked.
What does it cover? A ranking is only as complete as its station table. Ask which stations are in it before asking what it says — a missing city can move a river seven places.
Worst, mean or median? All three are defensible and they produce different orders. This one is worst-station, stated.
How many stations per river? A river with three stations and a river with thirteen are not measured to the same resolution, and the one with three is more likely to miss its own worst reach.
Primary or compiled? A compiler adds comparability and adds a layer between you and the measurement. Both matter; only one of them is usually mentioned.
What it does not measure
- It cannot rank stretches, only rivers. CPCB's own polluted-river-stretches classification does that and is a better instrument for it.
- It cannot measure anything the five monitored parameters miss — metals, pesticides and pharmaceuticals are all invisible here.
- It cannot tell you about flow. A filthy trickle and a filthy torrent rank the same and are not the same problem.
- It cannot be read as a trend. This is one year's compilation.
Where this comes from
Every figure above comes from one of these.
- Water quality data of river Yamuna, 2025 Central Pollution Control Board, National Water Quality Monitoring Programme · The Delhi figures the compiled ranking is missing
- River water quality data Central Pollution Control Board · The national monitoring programme the ranking is built from
- RiverWatch India RiverWatch India · The secondary compiler — useful for comparison, and the source of the coverage hole described above
Reuse freely — CC BY 4.0. Each source above keeps its own terms.