
Active situation
Kerala landslide
Four readings this page holds, and where each one is explained. Every source behind them.
What a landslide actually is
The rain is the trigger. The slope is the disaster.
Fill a bucket with damp sand and tip it out. It stands in a cone at a particular angle — steeper and it slumps. Every hillside is that cone, held at nearly the steepest angle it can manage.
Now pour water in. Water gets between the grains and takes away the friction that was holding them against each other. The angle that was just about fine is no longer fine.
That is why a landslide happens hours into heavy rain rather than at the first drop, and why a slope that has been wet for a fortnight fails in rain that a dry slope would have shrugged off.
And it is why what people do to a slope matters as much as the weather. Cut the bottom out for a road and the cone has nothing to sit on. Take the trees off the top and the first half-metre has nothing holding it. Blast rock above it and you have both loosened it and made it heavier. None of that shows up in a rainfall figure.
The numbers we cannot ignore
The geography of this risk is already mapped. What follows is what has been counted, and by whom.
The danger is not a distant hypothetical. The question is whether monitoring, planning and construction follow what is already known.
What science can say
The rain is the trigger. The slope is the disaster — and what was done to the slope is a decision somebody made and can be read in the record.
What has not been attributed
Nobody has established that climate change caused THIS event. Single-event attribution takes months, and for a glacier or rock collapse it is often not possible at all. A rising hazard across a region is not a finding about one flood in it.
All 12 standing figures for this hazard, and their sources
A landslide is not the rain. The rain is the trigger; the slope is the disaster. Every hillside in the Himalaya and the Western Ghats holds loose material at an angle it can just about keep, and it keeps it until something changes — water in the pores, the toe cut away for a road, the trees that held the top thirty centimetres taken off, a quarry face a kilometre uphill. Then it goes in seconds, at night, on the people living below it, and it goes on going: the initial failure at Wayanad in 2024 became channelised debris flows that travelled eight kilometres. India has mapped where this can happen. What it has not done is count it.
12.6% 0.42 million km², excluding snow-covered area — Of India's land area, prone to landslide hazard. The Geological Survey of India's own figure, and the basis of its National Landslide Susceptibility Mapping programme. It is an area of EXPOSURE, not a forecast: it says where the ground can fail, not where it will. Geological Survey of India
0.18 million km² North East Himalaya, including the Darjeeling and Sikkim Himalaya — The largest exposed region. Then 0.14 million km² in the North West Himalaya — Uttarakhand, Himachal Pradesh, Jammu and Kashmir; 0.09 million km² in the Western Ghats and Konkan hills across Tamil Nadu, Kerala, Karnataka, Goa and Maharashtra; and 0.01 million km² in the Eastern Ghats around Araku in Andhra Pradesh. Geological Survey of India
~80,000 1998–2022 — Landslides mapped across India. NRSC/ISRO's inventory, in three kinds — seasonal, event-based and route-wise. IT IS A MAPPED TOTAL AND NOT AN ANNUAL RATE, and the difference matters: the pan-India seasonal layer covers the 2014 and 2017 rainy seasons only, so the record is dense where somebody looked and thin where nobody did. National Remote Sensing Centre, ISRO
147 in 17 states and 2 union territories — Districts assessed for landslide risk. National Remote Sensing Centre, ISRO
Rudraprayag Uttarakhand — The district with the highest landslide density in India. It also carries the highest exposure of population and of houses of the 147 districts assessed. Tehri Garhwal is second. The atlas's socioeconomic risk ranking is, in the words of the landslide scientist who reviewed it, "quite experimental" — the ordering is a reading, the exposure is not. National Remote Sensing Centre, ISRO, Dave Petley, The Landslide Blog (AGU)
351 2024 — Recorded landslide deaths in India. 239 in 2023, a rise of 46.9 per cent — the second largest increase of any named cause in that table. THIS IS A FLOOR, NOT AN ESTIMATE: a death enters it only if a reporting authority attributed it to landslide and filed it under that cause. National Crime Records Bureau, Ministry of Home Affairs
4.4% 2024 — Landslide's share of all recorded deaths from forces of nature. For comparison, in the same table "causes other than above" is 1,626 deaths — 20.6 per cent of the total, with no named cause at all. Any reading of a cause-by-cause table has to carry that unattributed fifth alongside it. National Crime Records Bureau, Ministry of Home Affairs
392 with a further 150 people missing, as of 6 August 2024 — Killed by one landslide, at Mundakkai and Chooralmala in Wayanad. ★ READ THIS AGAINST THE NATIONAL ROW ABOVE. NCRB recorded 351 landslide deaths in the whole of India for 2024. One landslide in that year killed more. The two numbers are not both wrong; they are answers to different questions, and the gap is what the register does to a disaster — see `not_counted`. Dave Petley, The Landslide Blog (Eos, AGU)
570 mm — Rain in the two days before the Wayanad slope failed. Dave Petley, The Landslide Blog (Eos, AGU)
8 km affecting 86,000 m², per ISRO's analysis — How far the Wayanad debris flows travelled. A LANDSLIDE'S REACH IS NOT THE SIZE OF ITS SCAR. The initial failure became channelised debris flows that ran down existing stream courses and through the villages — which is why an evacuation drawn around the visible slope is drawn in the wrong place. Dave Petley, The Landslide Blog (Eos, AGU)
48 at least; 15 of them inside Ecologically Sensitive Areas — Stone quarries in Wayanad district. Counted from satellite imagery by Down To Earth. Nine are inside forests in two ESA villages, Kidanganad and Noolpuzha. Down To Earth
9,993.7 km² reduced from 13,108 km² — Kerala's Ecologically Sensitive Area, after the state asked for it to be cut. The Union environment ministry accepted the request. More than a decade after the Kasturirangan report was accepted, none of the states sharing the Western Ghats has finalised its Ecologically Sensitive Areas at all. Down To Earth
Figures in circulation that do not hold up
- 'Landslides in India are 66.5% North West Himalaya, 18.8% North East Himalaya, 14.7% Western Ghats' — widely repeated of the NRSC atlas, but the figures do not appear on ISRO's own page for the atlas and the landslide scientist who reviewed it reports no such split. It would in any case be a share of what was RECORDED, from an inventory whose pan-India layer is two rainy seasons.
- '151 dead at Malin' — the final official toll is reported this way almost everywhere and is very probably right; it has not been traced to a primary return here, so the contemporaneous count of 56 confirmed and about 120 missing is what this pack states, with the 151 named beside it.
- 'Meppadi was one of 18 Ecologically Sensitive Localities named by the Gadgil panel in 2011' — repeated in several outlets after the 2024 landslide, and not traced to the panel report itself. The ESA facts this pack does carry are Down To Earth's, which are counted rather than recalled.
- A death toll for the 2023 Himachal Pradesh monsoon. Credible figures run from about 320 to about 428 depending on who is counting and over what window, and the state's own Memorandum of Damages is the official series. Nothing here picks one, and no figure for that season is stated as this page's own.
- An annual number of landslides in India. There is no national series that counts events per year: GSI maps susceptibility, NRSC maps a 25-year inventory, NCRB counts filed deaths. None of the three is an event rate, and adding them does not make one.
Where
Kerala — and the river it runs into. Positions are real coordinates; the extent of the event is not known.
Region named in the reportingDownstream, in the pathThe satellite frame
Frame 515 km wide. The ring is an area, not a point: the reporting names the region, not a location inside it. Positions of the downstream places are true.
- Origin Kerala
- Direct impact India, downstream
What caused it
Candidate mechanisms, each with the evidence word it has actually earned and, where one exists, the counted thing that makes it plausible. Nothing on this list is established for this event.
How would we know?
- Rainfall-triggered slope failure
- The rain gauge nearest the slope, and the antecedent fortnight. Usually available within a day; usually the first thing stated and the least contested.
- Channelised debris flow
- The runout, on satellite imagery before and after. Distinguishing a flow from a slide decides where the danger was, and it is often settled only once a clear pass is available.
- The toe cut away
- The cut face itself, and the date it was made. Visible on imagery and in project records, and rarely named in the first reporting.
- Quarrying above the failure
- Quarry locations against the failure's catchment. Countable from imagery; contested in permits.
- What was taken off the slope, and what was put on it
- Land-cover change over years, not days. This is the slowest cause to establish and the one most likely to be missing from an event page written in the first week.
The mechanism in general
- Trigger
- Water. Rain intense enough or prolonged enough to fill the pore space in the slope material, which removes the friction holding it together. There is no single national threshold: it depends on the material, the angle, the vegetation and how wet the slope already was, which is why forecasting a landslide is a different and much harder problem than forecasting the rain.
- Conditions
- Loose slope-forming material at a steep angle — weathered rock, old debris, laterite, tea and cardamom soils in the Ghats, glacial and fluvial deposits in the Himalaya. Susceptibility is a function of slope, geology, the material and the vegetation, and GSI maps it nationally at 1:50,000.
- What science says
- The exposure is mapped and the annual count is not. GSI has a susceptibility map of 0.42 million km²; NRSC has ~80,000 mapped landslides over 25 years; NCRB has a deaths row that a single event can exceed. India knows where its slopes can fail far better than it knows how often they do, or how many people they kill.
- Human factors
- What was done to the slope, and what was built below it. Road and rail widening cuts the toe out from under a hillside; quarrying loosens it from above; terracing and levelling change where water goes; clearing the top of a slope removes the root mat that holds its first half-metre. None of these is weather. Down To Earth counted at least 48 stone quarries in Wayanad district from satellite imagery, 15 of them inside Ecologically Sensitive Areas and nine inside forests in ESA villages. The Western Ghats Ecology Expert Panel reported in 2011; the High Level Working Group that replaced it reduced the protected extent; the environment ministry then accepted Kerala's request to cut its own ESA from 13,108 to 9,993.7 km². A decade on, not one of the states sharing the range has finalised its ESAs. That sequence is a record of decisions, not of rainfall.
The mechanism for this kind of event, not a finding about this one. Himalayan disasters are often reclassified once fieldwork is done.
What the satellite sees
Imagery published here, not linked to. The same public NASA layers a newsroom would use, over the region the reporting names, on the dates either side of the event.
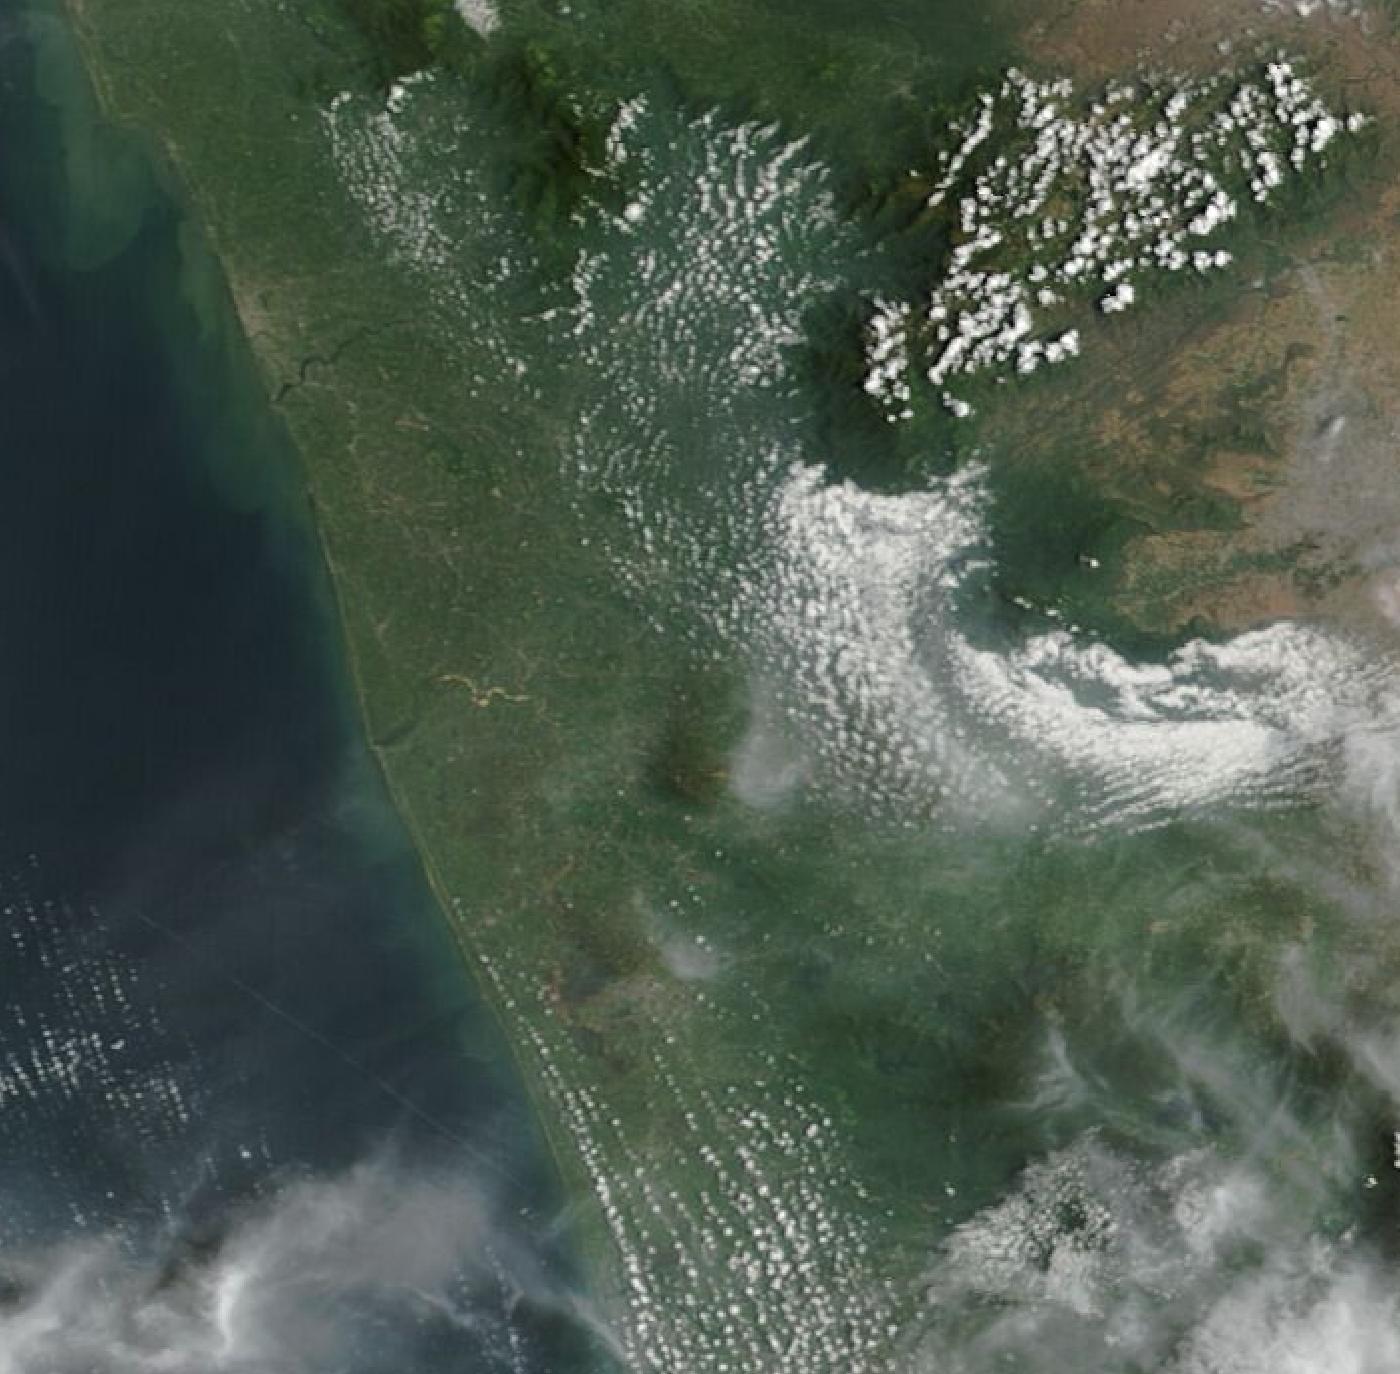
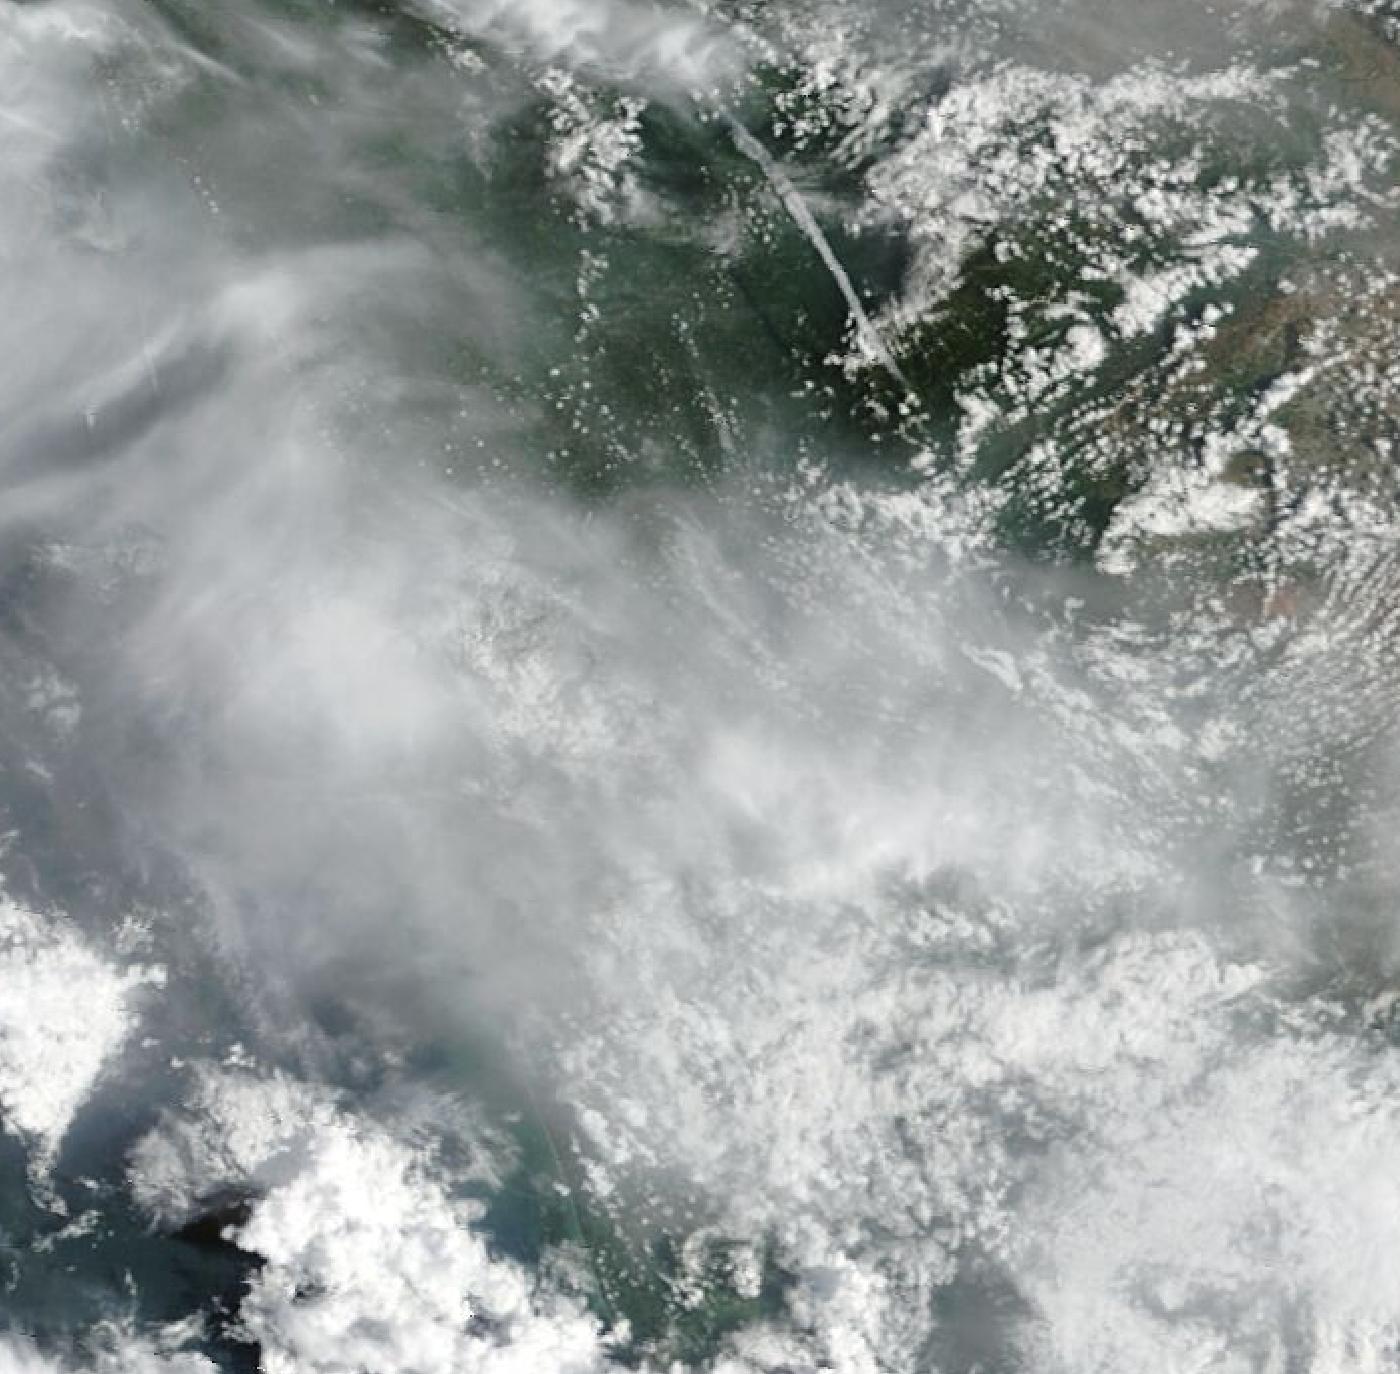
Drag to wipe. Same layer, same box, same satellite. Cloud 2.5% before, 1.3% after.
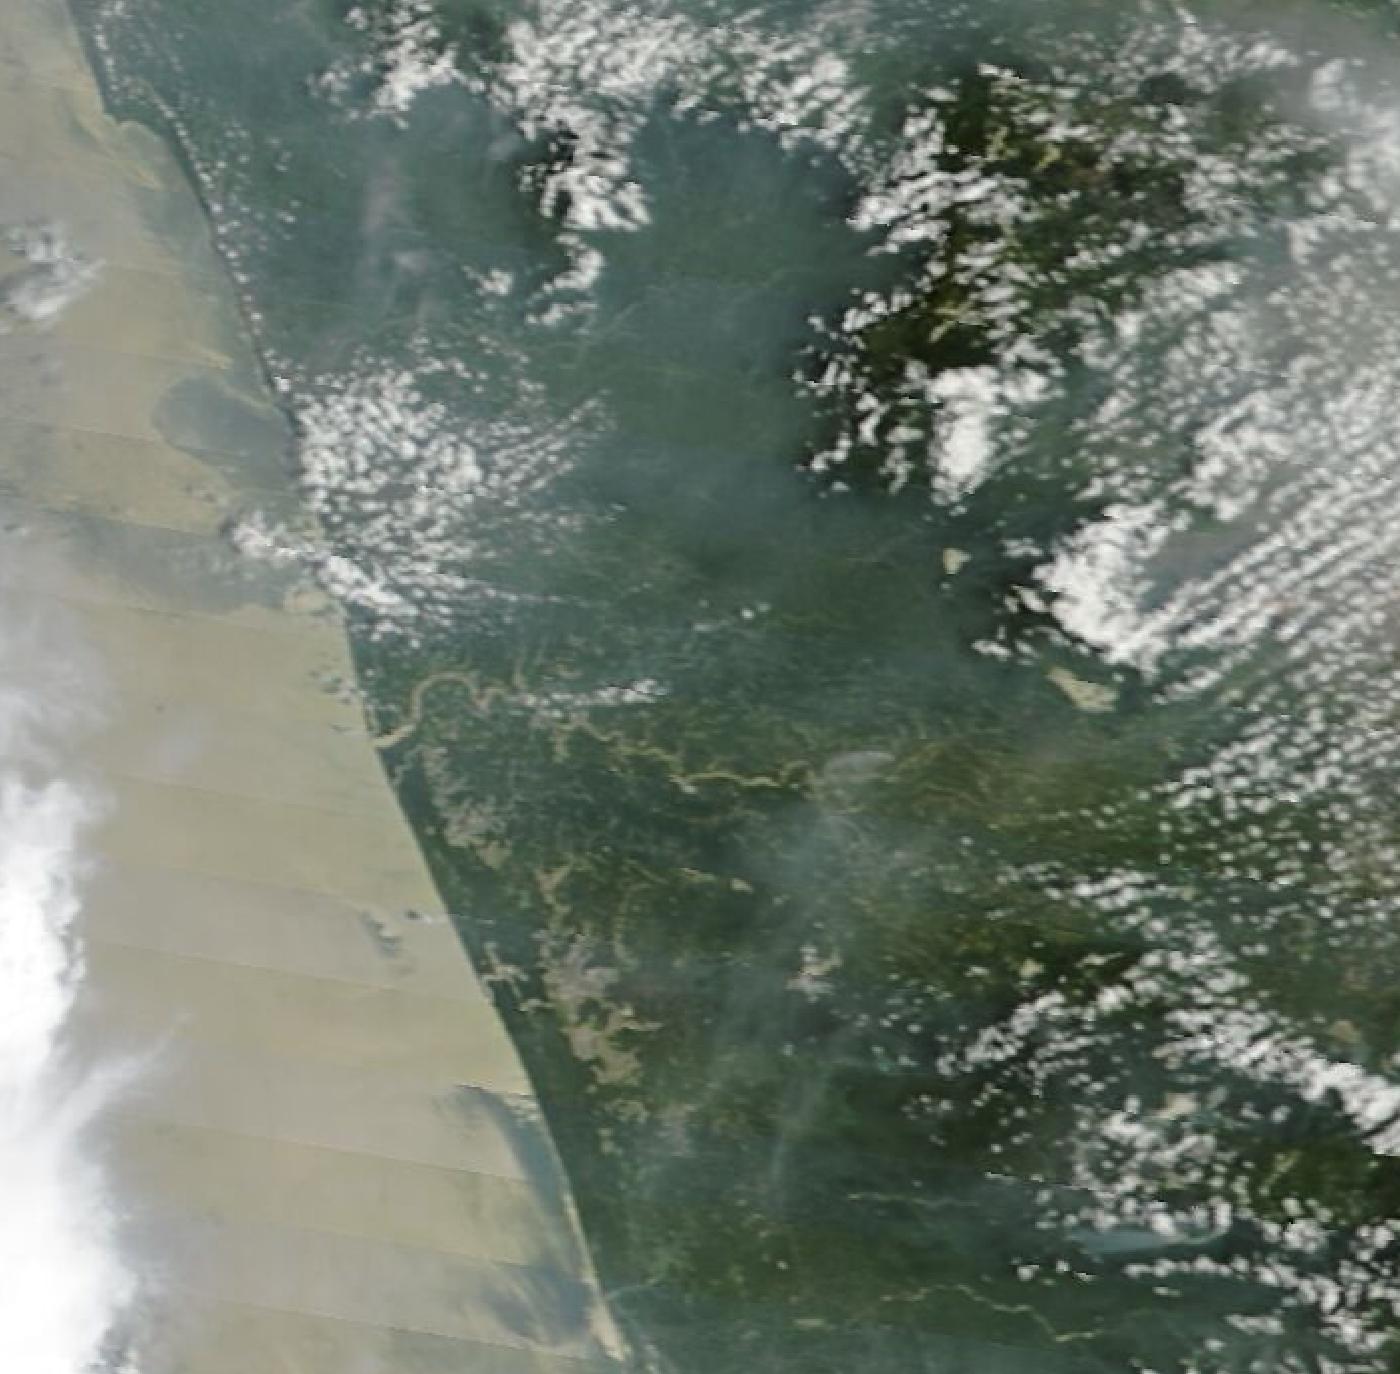
What the eye would see from orbit. Cloud is white, forest dark green, silt-laden floodwater pale brown. Printed here in black and white.
Cloud and snow are not separated. Both are bright and colourless at this resolution and there is no honest way to tell them apart from colour alone, so the figure this page prints is “cloud or snow” and means exactly that.
250 m per pixel. That is enough to show a changed river course, a flood plain and a large landslide scar. It is not enough to show a bridge or a building, and this page does not claim it is.
Frame 10.1–11.6°N, 75.506–77.034°E. The region reported, not a located site.
Open the live comparison Zoom, re-date, or switch to radar.
NASA Worldview Snapshots. Public domain, courtesy of NASA EOSDIS GIBS.
It has happened before
3 comparable events, with what each one actually cost. Every toll below is an official or peer-reviewed count, not a headline.
What happened in each, and what was learned
- Mundakkai–Chooralmala, Wayanad · 30 July 2024
- Mundakkai and Chooralmala, Wayanad, Kerala. 570 mm of rain in two days on slopes carrying tea farms; the failure became channelised debris flows that ran eight kilometres through the villages. Most of the dead worked on the farms, or were their families.
- Malin, Pune district · 30 July 2014
- Malin, Ambegaon taluka, Pune district, Maharashtra. A hillside came down on a sleeping village before dawn after days of rain. Deforestation, hill-cutting and the use of heavy excavators on the slope were all named at the time as contributing, alongside backwater from the Dimbha dam. Most of the dead died of asphyxia.
- The register is smaller than the event · 2024
- The national register disagreed with a single event. NCRB's Table 1.0 filed 351 landslide deaths for the whole of India; the Wayanad landslide alone was confirmed at 392 with 150 missing. Neither figure is disputed by the body that published it. What separates them is the filing: NCRB counts deaths a reporting authority attributed to landslide, so deaths recorded under flood, or under the 1,626 with no named cause, or not returned in time, are simply not in the row.
What these counts leave out
- THE NATIONAL DEATH ROW IS SMALLER THAN ONE LANDSLIDE. NCRB's Accidental Deaths & Suicides in India 2024 records 351 landslide deaths for the whole country; the Wayanad landslide of 30 July that year was confirmed at 392 with 150 missing. A death reaches that row only if a reporting authority attributed it to landslide and filed it under that cause — so deaths filed under flood, deaths inside the 1,626 with no named cause at all, and deaths in returns that arrived late are outside it. The row is a floor and this site publishes it as one.
- Landslides where nobody was looking. The pan-India seasonal inventory covers the 2014 and 2017 rainy seasons; the rest of the ~80,000 is event-based and route-wise, which means concentrated on the disasters somebody studied and the roads somebody surveyed. The record is thinner in the North East than the hazard is.
- The slope above a village. National susceptibility mapping is at 1:50,000 — a scale that can say which valley carries the hazard and cannot say whether the hillside behind a particular row of houses will hold. GSI is upscaling to finer mapping on selected critical sectors; until that reaches a place, nobody living there has a map at the scale of their own risk.
- Damage that is not death. Houses, livestock, cowsheds, terraces, roads and the season's crop are counted by state memoranda in rupees, on different definitions in different states, and are not aggregated nationally by cause.
The alarm for India
Nepal is not somebody else’s disaster. The triggers differ; the vulnerability is the same, and it is already measured.
Confirmed India impact
No named source has reported an Indian casualty or evacuation figure.
What is already counted above India
The corridors this maps onto
Downstream of this event: The Himalayan road and hydropower corridors — Rudraprayag and Tehri Garhwal above all, where landslide density and exposure of people and houses are both highest in the country — and the Western Ghats plantation belt from Wayanad through Idukki and Kodagu into the Konkan, where the slopes carry settlements, quarries and a monsoon that is arriving in shorter, harder bursts.
This column is exposure, not an outcome. Nothing in it is a report that anything has happened in India. It is where the same hazard would arrive.
What happens next
Two horizons. A level only where a published threshold and a number exist to put something against — everything else is named as a watch, not graded.
Next 24–72 hours
Coming days and weeks
The rainfall level is computed from a forecast model over a representative point — Open-Meteo forecast API, not a gauge at the event. The ungraded items are the mechanisms that follow this hazard. This page does not pretend to know their probability.
Data and sources
Everything this page is built from, counted by kind. Nothing here is quoted in this site’s own voice.
View all 1 sources
Reported
- Flash Flood and Landslides Kill 10 in India's Kerala State as Officials Promise Aid and Better River Warnings Nature World News · Tue, 29 Sep 2026 05:26:34 GMT
A headline is evidence that something was said. It is never evidence that it is true — which is why every figure at the top of this page carries the outlet that printed it and, where they disagree, all of them.
What is not established
- Casualty and damage figures are not established here. Any number in the headlines below belongs to the outlet that printed it.
- The mechanism is this page's reading of how the event was first reported, not a finding. Himalayan disasters are often reclassified once fieldwork is done.
- The extent of the affected area has not been verified against satellite or official mapping.
- Whether this event is continuing or has passed is not established.
Last changed 10:56 IST, 29 Sep 2026.
This is one event
The standing picture — how much extreme rain India actually gets, what IMD counts as extreme, who the rain kills, and what is changing across twelve cities — is on the situation page this belongs to.
A gap is a gap
An empty day stays empty — a gap in the record is a gap in the record, never a zero.
Cite this page
Reuse freely — CC BY 4.0. Every figure carries its source and its cadence in how the number is made. If you quote a number from here, quote the kind with it. Each upstream source keeps its own terms.
This is what we are doing.
It is not enough.
The work against this reading
Mostly the written record, and going to look. Three of the essays on this site were reported out of flood years, and Gram Anubhav takes groups into villages living with this, run with over a hundred grassroots partners in the villages themselves.
And why it is not a reply
Publishing and going to see are not resilience. Swechha does not build drainage, and nothing here reduces the 3,594 deaths this page counts. What the work does is make the count harder to ignore — a smaller claim than it sounds, and the only one the evidence supports.
Understand the data
- What counts as extreme rainfall?IMD's day categories — and the reason a day is the wrong unit for a cloudburst.
- How is Delhi's rainfall measured?Gauges, a seasonal normal, and why two Delhi rainfall figures rarely agree.
- Measured or modelled?The first question to ask of any environmental number, and the one most often skipped.
Once a month, what these numbers did.
One email. What the six readings did that month, what moved and what did not, and what we did about it. Nothing else, ever — no appeals between digests, and your address is never shared with anybody.
Confirm by email before anything is stored. Every message carries a one-click link to stop them.